Harmonic Patterns ProHello All,
We need to make things better & better to solve the puzzle and I try to do my best on this way for the community. now I am here with my Harmonic Patterns Pro script.
Harmonic Pattern recognition is the basic and primary ability any trader develops in technical analysis. Harmonic pattern recognition takes extensive practice and repetitive exposure. in general chart patterns are categorized into “continuous” and “reversal” patterns. Harmonic patterns construct geometric pattern structures using Fibonacci sequences. These harmonic structures identified as specified harmonic patterns provide unique opportunities for traders, such as potential price movements and key turning or trend reversal points. This script is developed to find following patterns by using the options you set. I have to say that this is not a strategy and you should not use this script blindly, instead, I strongly recommend you to create your own strategy using this script with other tools/indicators, such moving averages, Support/Resistance levels, volume indicators, sentiment indicators etc.
- Following Harmonic Patterns are available in this version:
-->Gartley
-->Butterfly
-->Bat
-->Crab
-->Shark
-->Cypher
-->Alternate Bat
-->Deep Crab
-->5-0
-->3-Drive
-->AB=CD
-->Descending Triangle
-->Ascending Triangle
-->Symmetrical Triangle
-->Double Top
-->Double Bottom
How the script works and finds harmonic patterns:
- It uses zigzag like other harmonic pattern script but there is a difference. this scripts searches up to 200 bars, finds/creates up to 200 XABCD using zigzag waves and searches predefined harmonic patterns
- It can find multiple harmonic patterns on a candles with different sizes and lengths
- Each pattern is shown using its own color (you can set 8 different colors)
- it shows Entry, Target1, Target2 and Stop-loss levels for each found Patterns
- It shows pattern validation zones for each found pattern
- it has all-in-one alerts. you set the alerts you want in the indicator options and you create only 1 alert for each symbol.
- it has prediction future and it can show many predicted patterns at the same time, each predicted patterns validations zones are shown separately
- While on real-time bar it searches and shows patterns for the visible area
it has followng alerts: . these in all-in-one alerts. it means that you choose the alerts in the options and enables any of them and then create only one for each symbol. and you get eany alert you choose. (" Any alert() function call "). in this version "Any alert() function call" alert is only alert you can use, if I get some requests I can try to other alerts as well.
New Pattern Found
Pattern Updated
Entered Position
Reached Target
Stop-loss
Validation zone is calculated using XABC points any pattern by using Y-Axis error rate. so if you increase Y-Axis error rate then the script can find much more Harmonic patterns.
X-Axis Error Rate is used for a few pattern such AB=CD for the distance of AB wave and CD wave.
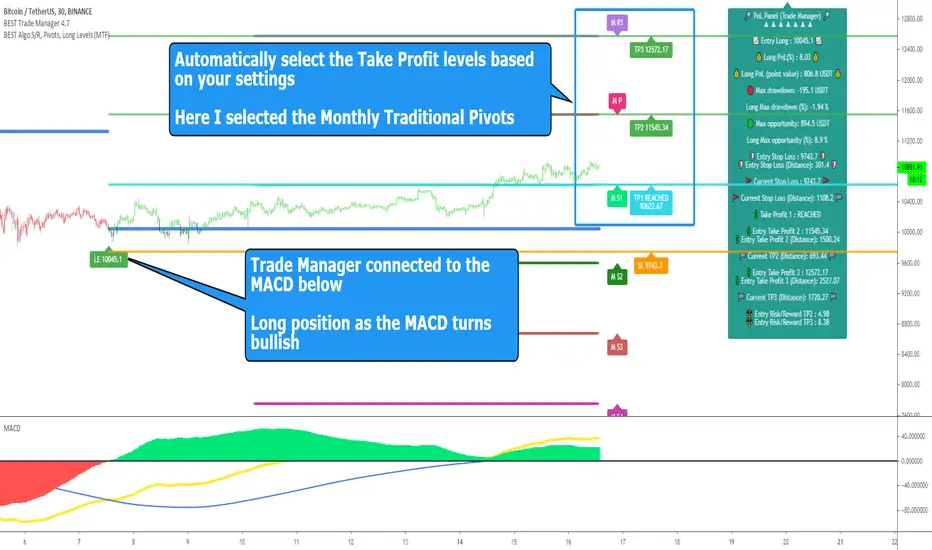
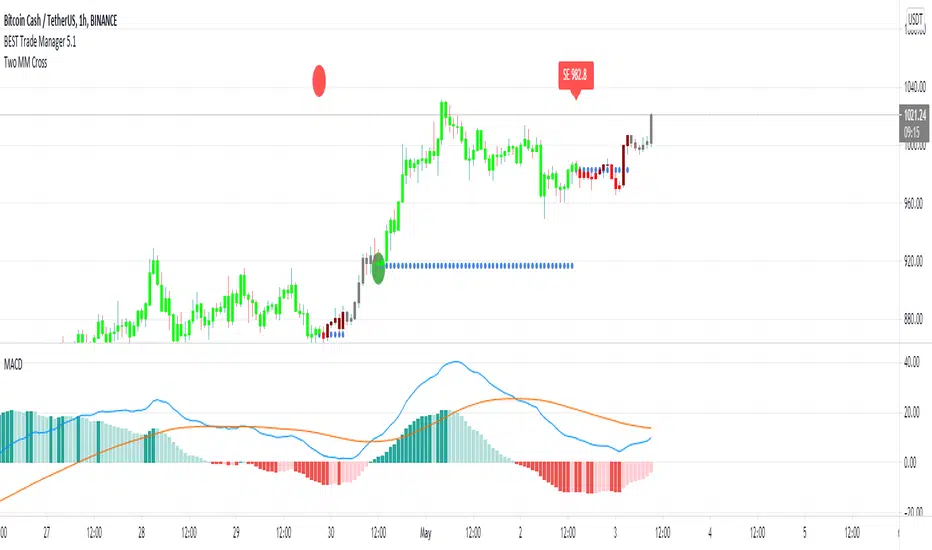
The script can show Recommended Entry, Target 1, Target 2 and stop-loss levels for each active patterns. of course you can use these levels or you can set your own levels. you can see the screenshot below.
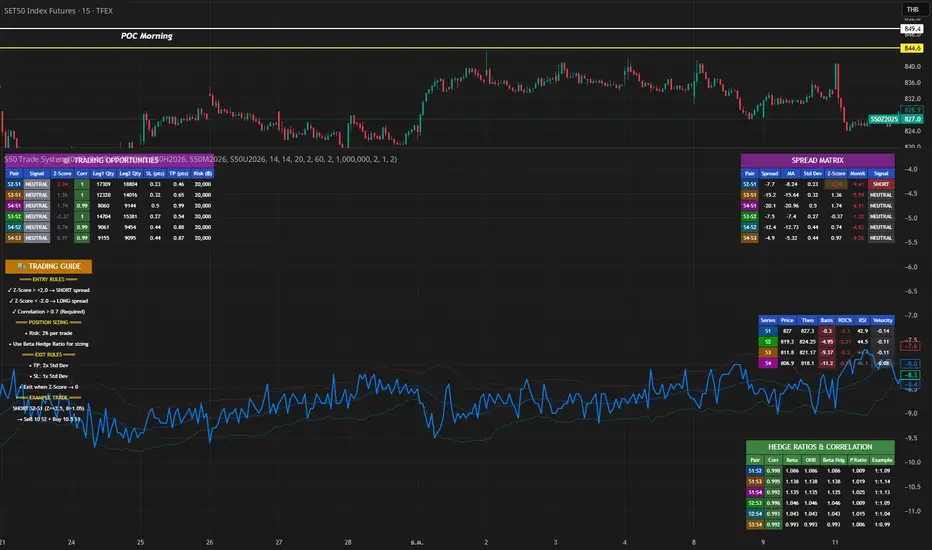
The script can show statistics panel. when statistic panel is enabled then no pattern is shown on the chart, the script shows ONLY statistics panel. This was done because of complexity of the script.
If you enables Prediction then pattern checks all possible XABC formations in the last 200 bars and finds/shows predicted patterns if there is any.
if you "replaying" then the script searches patterns only for last bar (if any update on zigzag on last bar), not for historical ones. you should take care while you use "Replay" feature of Tradingview
Now lets see the options:
Minimum ZigZag Period: this is minimum Zigzag Period to create new Zigzag wave. default value is 10 and minimum value is 4
Y-Axis Error Rate %: this is the error rate to create validation zones for each pattern, there is almost no perfect pattern, so we try to create a zone using error rate
X-Axis Error Rate % : this is used for a few pattern (such AB=CD) to check wave lengths on time basis
Minimum Pattern Length: This is Minimum Length for the Patterns to be searched. in Number of Bars
Maximum Pattern Length : This is Maximum Lengths for the Patterns to be searched. in Number of Bars
Max Number of XABCD to search: Maximum Number of ABCD to search pattern on each move, there are many possible XABCDs on the chart, this limitation is the number for how many of them will be searched
Find Patterns for: is the option about taking position. there are three options: "Long and Short", "Only Long", "Only Short"
Max Patterns on Each Bar: Maximum Number of Patterns that can be found on each bar, by default it's 3
Keep Pattern Until: you have two option "Target1" and "Target2". when a pattern found and if it reach any of these targets it is accepted as it's reached target and removed. this is also used inthe statictics panel!
Show Recommended Entries & Targets: if enabled then the script can show "Recommended" Entry, target1, target2 and stop-loss leves. you can use these levels or you can use your own calculation for each pattern
Entry = % of Target 2 : Entry Level for each pattern is calculated using the distance between D positon of the pattern and target 2. by default it's 16%, you can set it as you wish
Entry&Target Line Style: you can set line style for entry/target/stop-loss levels
Show Pattern Validation Zones: as explained above, for each pattern validation zone is created using error rate (Y-axis error rate). you can see it for each pattern
Source for Invalidation: this source is used for validation zones. there is two options: Close or High/Low. this source is used while invalidated the pattern. by default it used "close" price as source
Line Style: this is line style for validation zones, solid, dashed or dotted
Pattern Prediction/Possible Patterns: if you enable this option then the script calculates/searches possbile patterns and shows their levels in a label if there is one or more
Show Label & Zone: this is about how you want to see predictions, there are two choices: "Show Only Label", "Show Label & Zone"
Show Statistics Panel : if you enable this option then the script starts searching all harmonic patterns from the first bar for the last bar and keeps statistics for all of them and the shows in a table. you can see screenshot below
Panel Position: you can set panel location of statistics panel using this option
Show Rates Between Waves: if you enable this option then rate between the waves are shown. by default it's enabled
Keep Last Pattern on the Chart : if you enable this option then even if pattern is invalidated/reach target/stop-loss it stays on the chart until new pattern is found. by default it's enabled
Line Style : line style for the last pattern on the chart
Patterns to Search: you have options to enable/disable the patterns listed above to find&show, you can enable/disable any pattern in the list. by default all patterns are enabled except AB=CD pattern
in the ALERTS menu you have many options to enable/disable the alerts you want. Alerts contain Symbol name, Pattern name, Direction as Long/Short, Recommended Entry, Targets, SL levels.
- New Pattern Found
- Pattern Updated
- Entered Position
- Reached Target
- Stop-loss
Show Zig Zag: if you want to see Zig Zag then you should enable this option, and you can set the colors for the Zig zag. by default it's disabled.
and some other options for coloring and line styles of the patterns..
This is how XABCD points found using zigzag waves, I tried to explain it in the video below:
Validation zones and Entry, Target1, Target2 and Stop-loss levels:
Each pattern has its own color, you can see which levels, letters, lines etc belongs to which pattern:
Pattern prediction: you can enable it and change its background color:
How Statistics panel looks like. if there is active pattern then it's shown in different color in the table
This screenshot shows how the script finds and shows multiple patterns on a candle:
And some examples for triangles and Double top/bottom patterns:
Symmetrical triangle:
Ascending triangle:
Double bottom
and many others..
While using different time frames the script can find same patterns, in the following screenshots you can see how same patterns found on 5 and 10 min chart. of course this depends on the Zigzag Period
in this video, the idea and the indicator options is explained:
I can say that this is very complex script and it takes very long time to develop. I used my all programming ability and Pine ability to develop it. I hope you like it and make a lot of profit.
DISCLAIMER: No sharing, copying, reselling, modifying, or any other forms of use are authorized for the documents, script / strategy, and the information published with them. This informational planning script / strategy is strictly for individual use and educational purposes only. This is not financial or investment advice. Investments are always made at your own risk and are based on your personal judgement. I am not responsible for any losses you may incur. Please invest wisely.
Enjoy!
Skrip berbayar